The Next level
You now have a good initial insight into your application and can respond to incidents in broad terms. If you want to take the next step towards a full-fledged APM solution, there are several options.
Think of Grafana, Datadog, or New Relic. All of these options provide the ability to collect your logs, traces, and metrics and display them in a central overview. You can choose to host your own stack, for example using Grafana’s LGTM stack (Loki = logs, Grafana = web interface, Tempo = traces, Mimir = metrics), or opt for a hosted solution such as Datadog or New Relic.
Laravel also offers a service for this, called Nightwatch. With this, you can easily onboard your Laravel application by running an agent on your system. You then get insight into your application’s behavior in the Nightwatch dashboard, including response times and requests, specific traces, and logs.
Another well-known option is the ELK setup, in which we use Elasticsearch as the datastore, Logstash as the collector, and Kibana as the viewer. This ecosystem is known for searching through large amounts of data extremely quickly.
If you are concerned about potential vendor lock-in, you can use OpenTelemetry. This is a framework that allows you to collect different types of observability data and send it to a backend. That backend can still be one of the platforms mentioned above.
To make this easier, you can use Kubernetes. Within it, you can take advantage of autodiscovery capabilities. For example, Prometheus can detect which applications have been started within the cluster and automatically collect the corresponding metrics. Another good option is the OpenTelemetry operator, which handles the collectors and auto-instrumentation of your application, so this does not need to be configured manually.
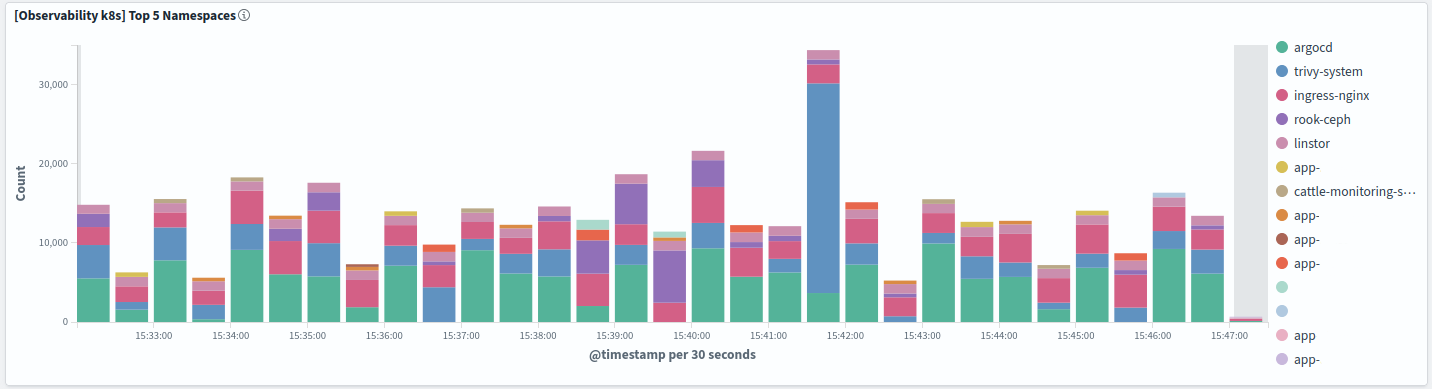
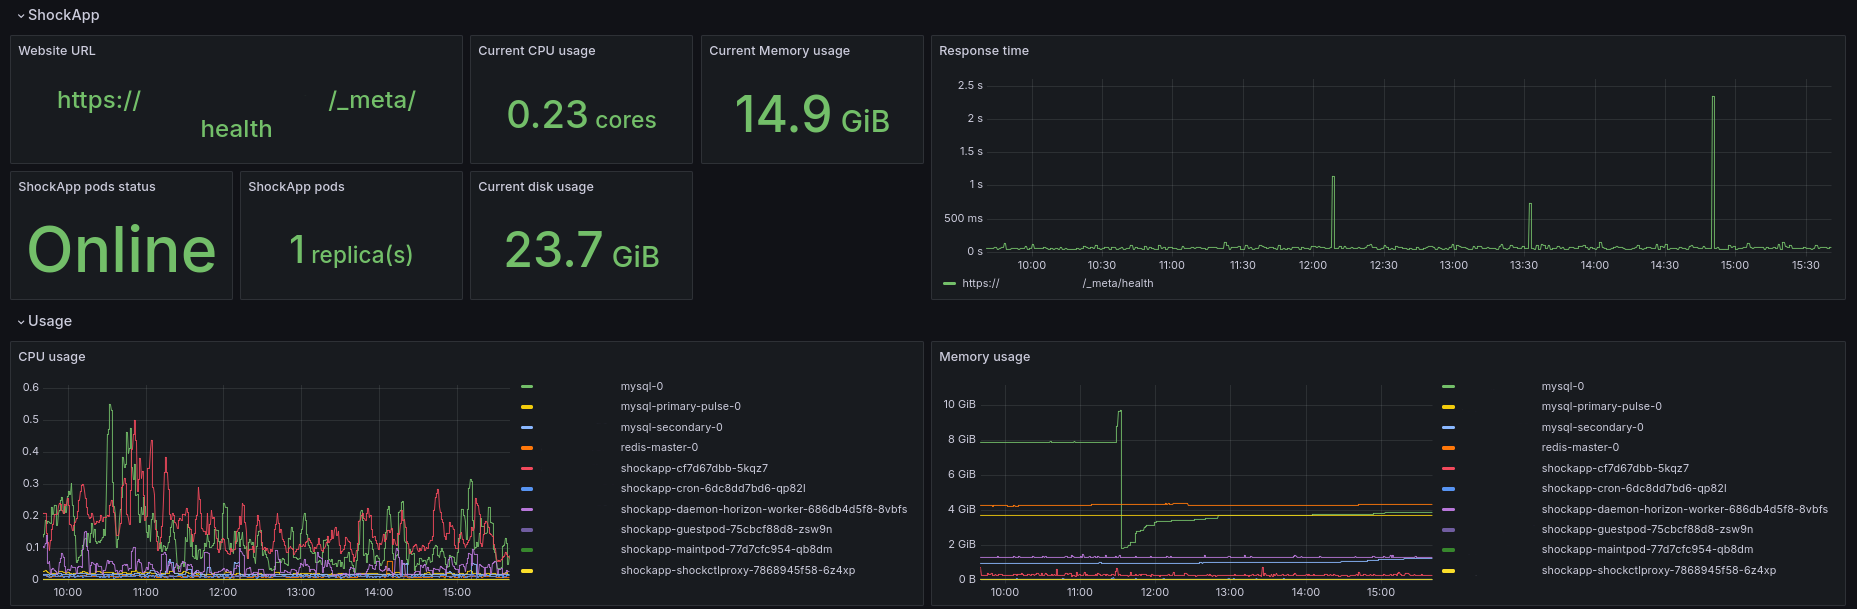
As an example: within our Shock Media Kubernetes clusters, we use Fluent Bit in combination with OpenSearch. This ensures that we can index large amounts of log data and make it quickly available to customers, so that in the case of a (pending) problem, the logs are immediately accessible. We combine this with metrics from Prometheus in a Grafana dashboard. The power of Grafana lies in creating application-specific dashboards, where you can see exactly how your application behaves.
The goal is to detect and resolve problems quickly. Within our observability portal, you then have all the data in one place.
Conclusion
Running a production website comes with its own set of challenges. Observability does not eliminate all of them, but it certainly provides guidance and helps ensure that your application can grow along with your customer base. If you get stuck setting up Observability or are looking for hosting for your Laravel applications, contact us now.